

Featured work
Farm 01: before and after the fires
The same property, before and after the fires. The Google Maps satellite view shows it before; our drone imagery shows it after the sheds were rebuilt, giving a current, dated record of the rebuild.
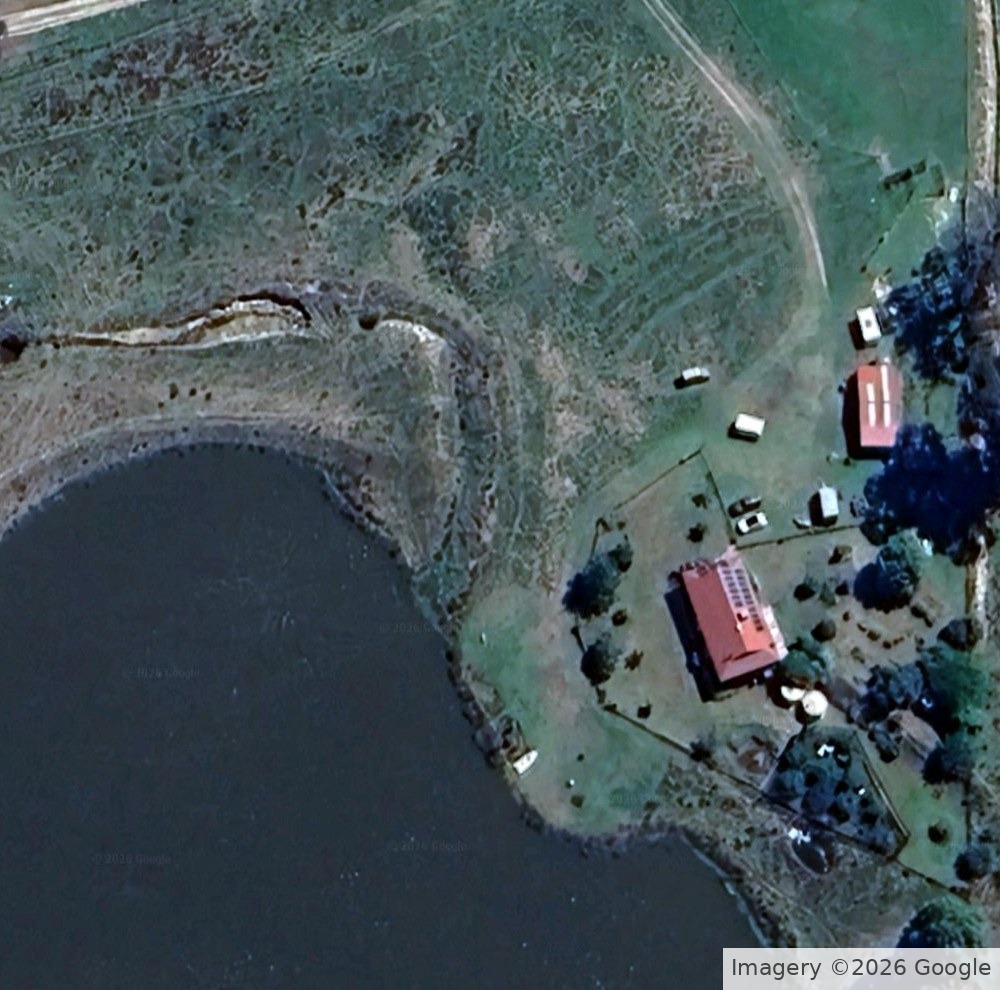
Google Maps satellite view of the property before the fires.
Imagery ©2026 Google
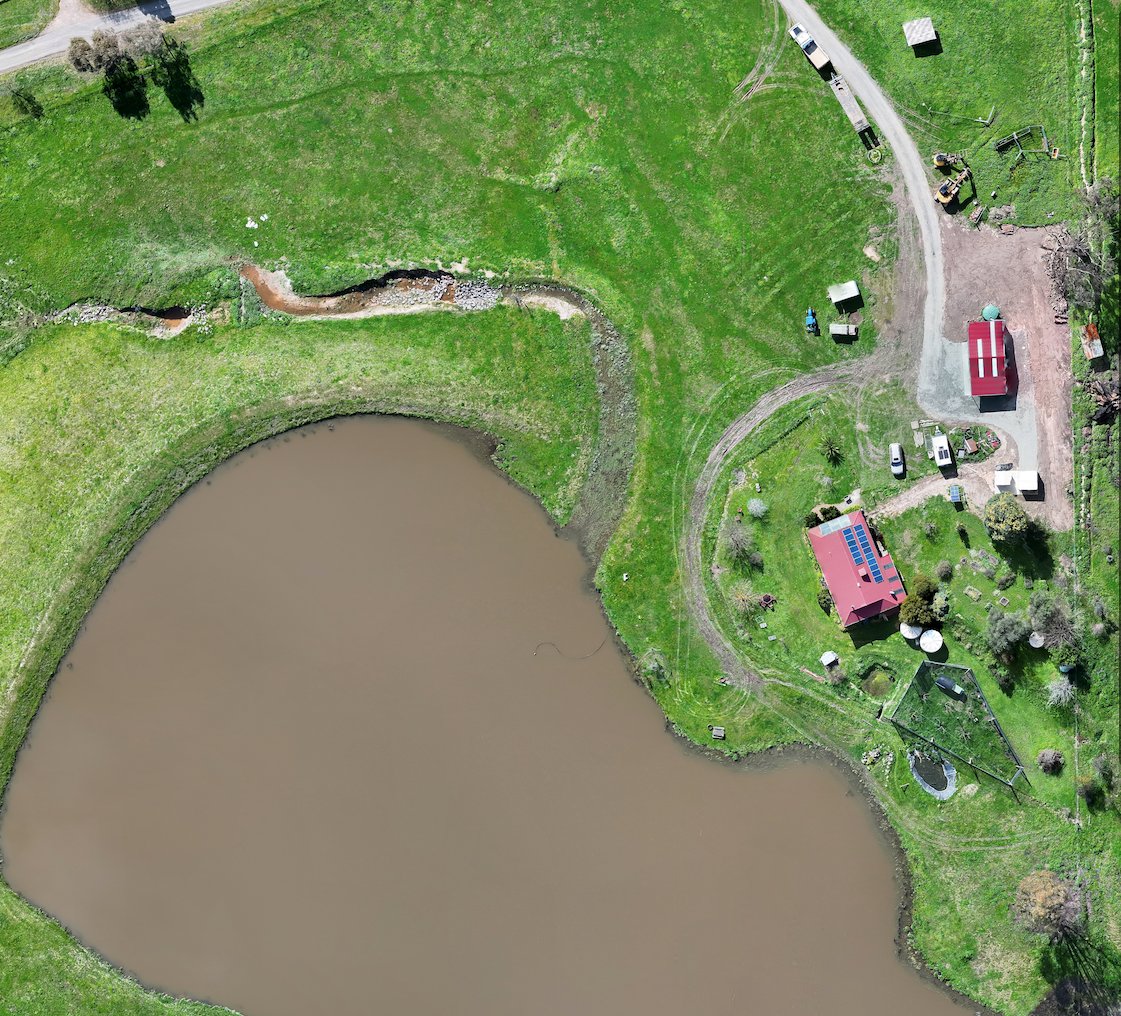
The rebuilt sheds, flown by us after the fires.
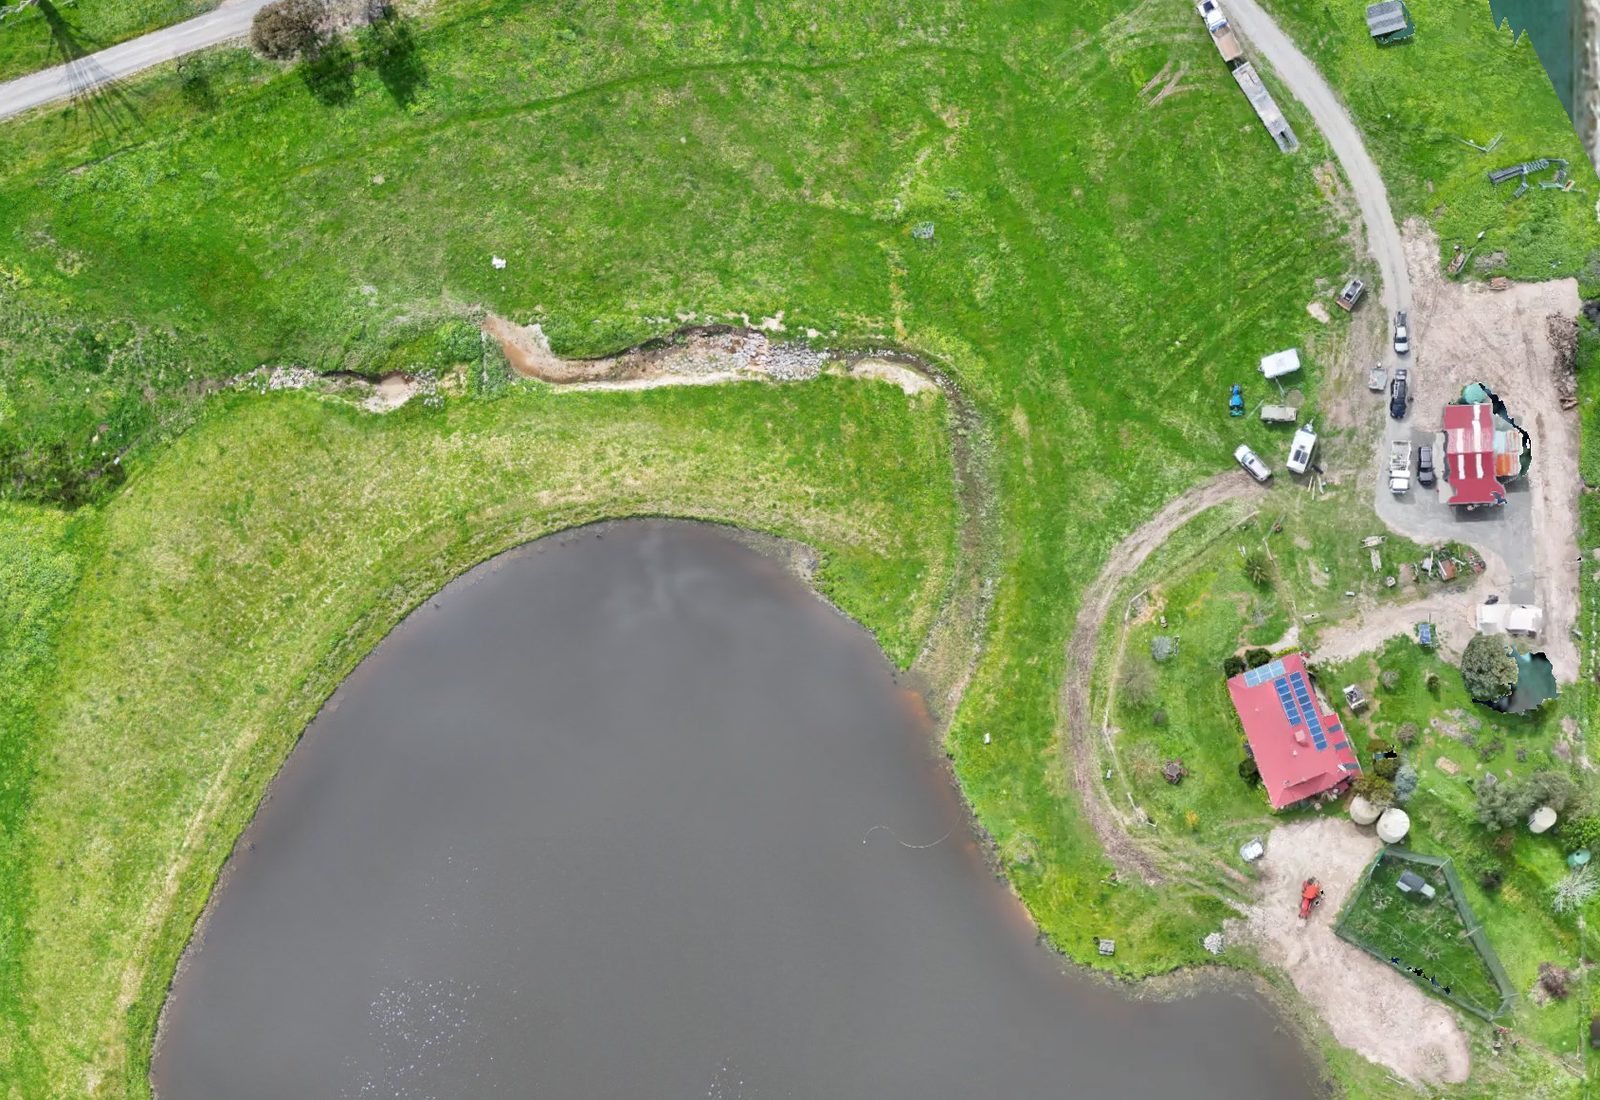
We flew Stoney Creek, with green paddocks, a large dam, tracks and the farm buildings in one overhead view.
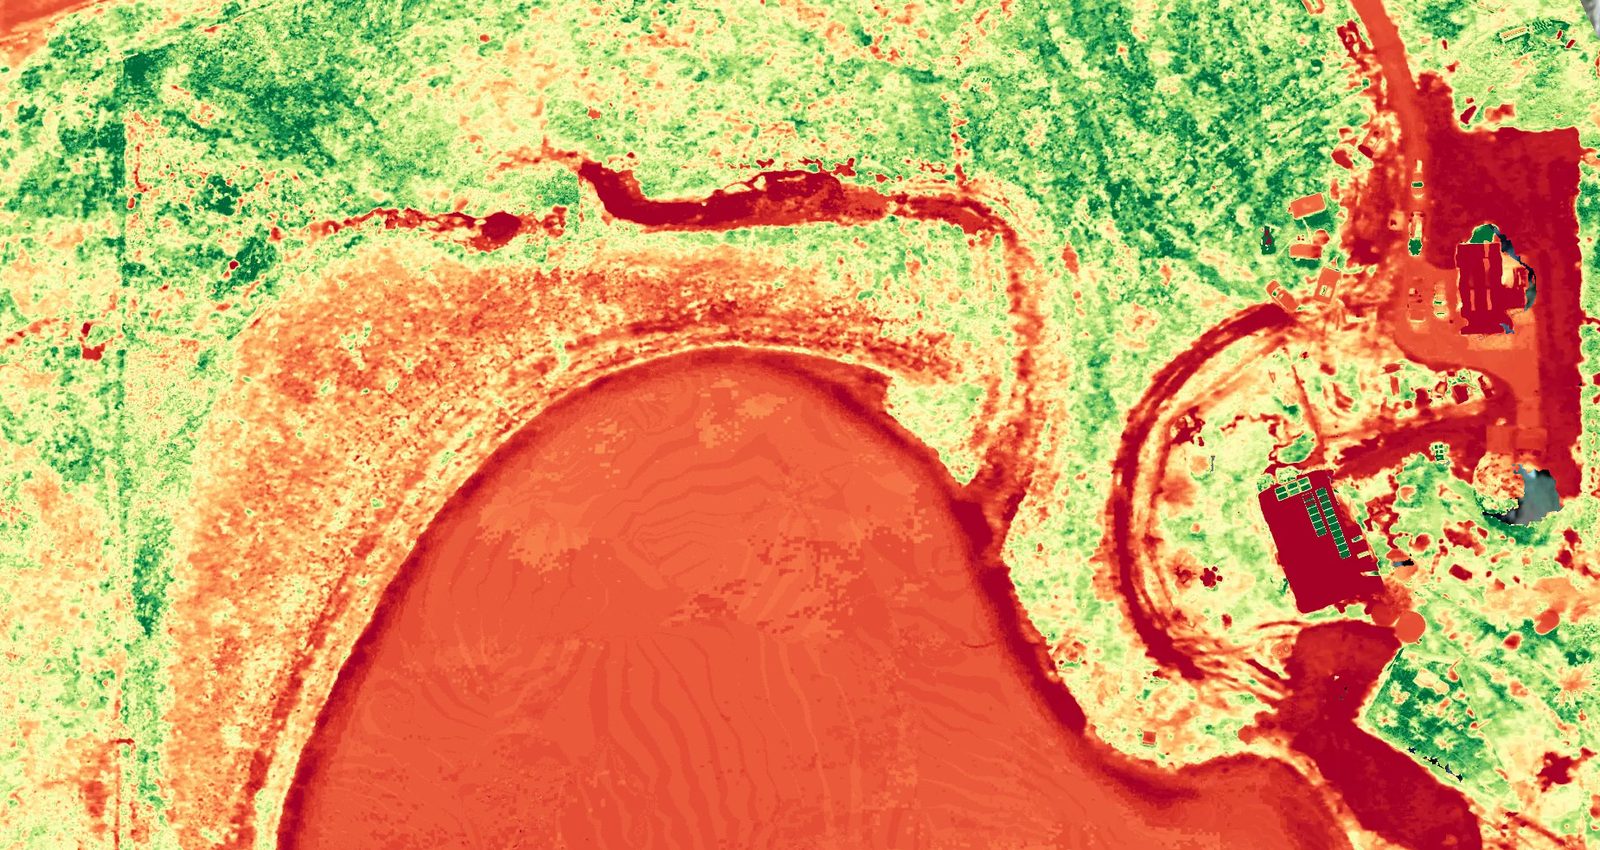
We made this plant health map of the same area at Stoney Creek, showing the dam, paddocks, tracks and buildings in colour so growth patterns stand out across the farm.
Green = denser, healthier green growth; yellow = mid-range growth; orange and red = sparse or stressed growth, bare ground, tracks and water. Colours are compared within this map only.
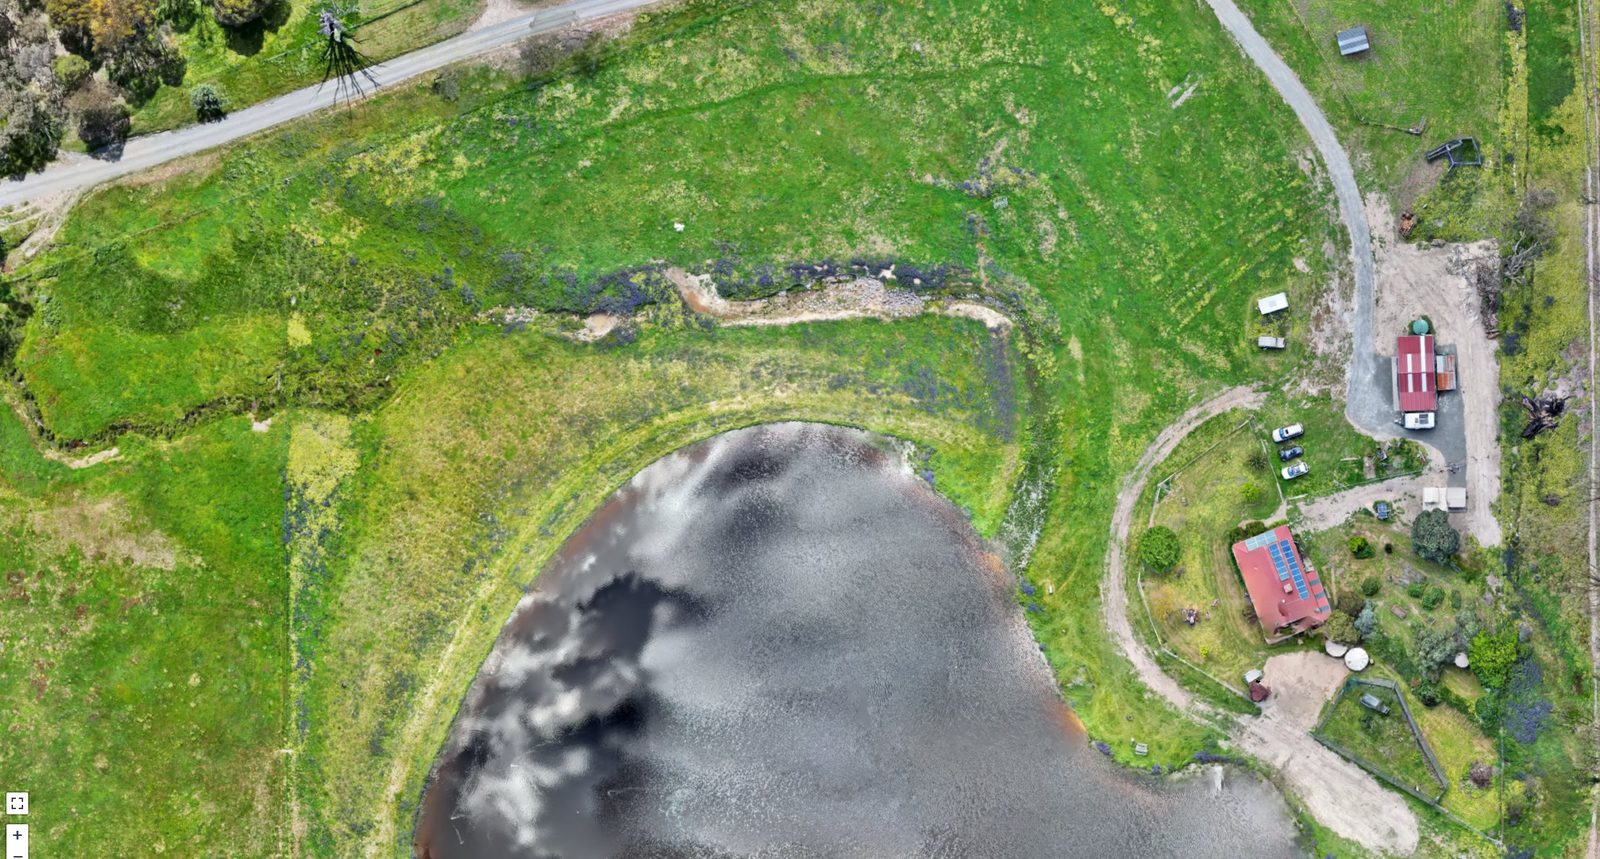
We mapped the whole property in one joined-up overhead view, with the dam, paddocks, sheds and tracks all in view.
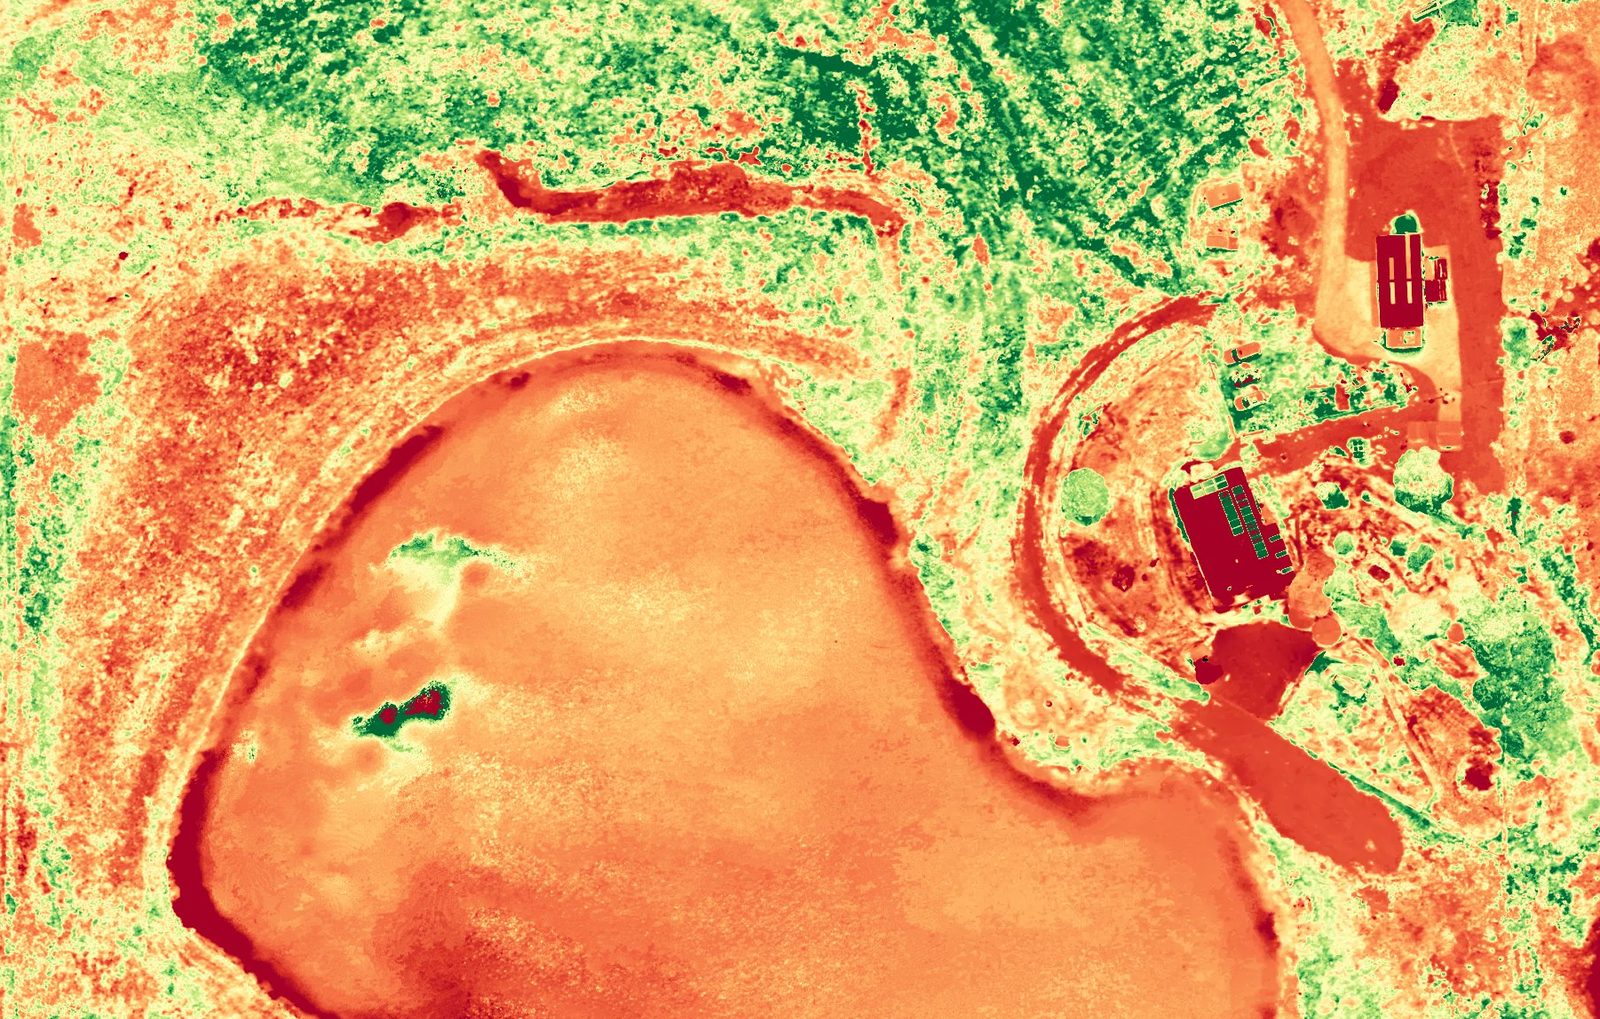
We flew it again a month later and made this plant health map of the same property, showing the dam, paddocks and sheds in colour so growth patterns stand out across the farm.
The small orchard block south-west of the house (the cut-triangle block) was heavily pruned between these plant health flights — you can see the canopy drop away.
Green = denser, healthier green growth; yellow = mid-range growth; orange and red = sparse or stressed growth, bare ground, tracks and water. Colours are compared within this map only.
Want a record like this of your property?
Tell us about the site and what you need. We'll send back a plan and a quote.